

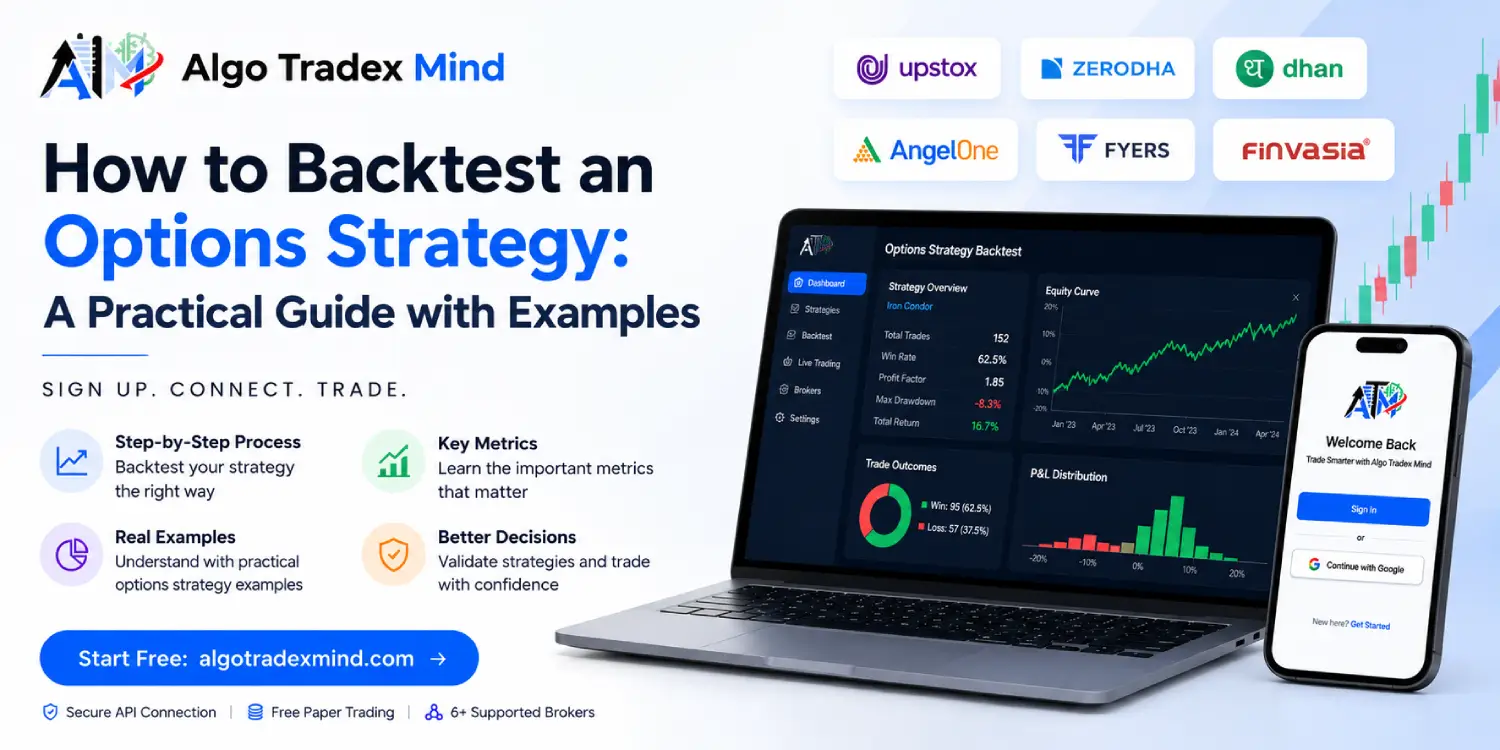
Understanding how to backtest options strategy models requires precise rules and accurate market records. Backtesting applies specific entry and exit conditions to past market behaviour to measure potential profitability. Traders simulate positions using automated software to validate mathematical edges before risking actual capital. This process identifies statistical viability, isolates system flaws, and establishes realistic expectations for future performance without emotional interference or manual calculation errors.
What is the exact process to backtest options strategy effectively?
The exact process involves defining strict entry criteria, setting target profit parameters, and establishing hard stop-loss limits. Traders input these rules into a testing platform that scans past market movements. The software executes simulated trades across historical data to generate performance metrics. This systematic approach reveals mathematical probabilities, helping traders refine their conditions before deploying capital into live market environments.
Defining Entry and Exit Parameters
Building a reliable testing framework starts with absolute clarity. Ambiguous rules destroy the validity of any simulation. Traders must define the exact time of day for entry, the specific technical indicator values required, and the precise strike prices to select. For example, a rule might dictate selling the At-The-Money call and put options at 09:20 AM on Wednesday mornings. This leaves no room for subjective interpretation by the software. Exit parameters demand the same level of rigidity. Traders define target profits as fixed monetary amounts, percentages of the collected premium, or specific technical reversal signals.
Understanding Strike Selection Mechanics
Selecting the correct strike price forms the core of options trading. Systems must categorise strikes dynamically based on the underlying index price at the moment of entry. Hardcoding specific strike numbers fails because the underlying index moves constantly. Reliable software identifies strikes relatively, such as selecting the strike 100 points Out-Of-The-Money from the current spot price. Testing different strike selections reveals how premium decay and price movement affect the overall trade outcome across various market regimes.
Structuring Hard Stop-Loss Limits
Capital preservation determines long-term market survival. Testing without strict stop-loss parameters creates an illusion of high profitability while masking catastrophic tail risks. Traders structure stop-losses on individual option legs or on the combined premium of multiple positions. Testing reveals the mathematical reality of these limits. A tight stop-loss might trigger too frequently due to normal market noise, while a wide stop-loss exposes the account to massive drawdowns during sudden index spikes. Systematically adjusting these parameters during the simulation phase helps traders locate the optimal balance between risk protection and trade continuation.
Why do traders need accurate historical data for options backtesting?
Accurate market historical data provides the foundational reality for any options backtesting environment. Options pricing relies heavily on implied volatility, time decay, and underlying asset price movements. Low-quality data with missing ticks produces false profitability signals. High-fidelity tick records ensure the simulation mirrors actual past conditions, allowing automated systems to account for rapid price gaps and realistic spread variations accurately.
The Impact of Missing Tick Data
Market data arrives in continuous ticks. Cheap or free data sources often aggregate these ticks into one-minute or five-minute intervals, discarding the extreme highs and lows that occurred within that timeframe. When a system tests against aggregated data, it might assume a stop-loss was never hit, showing a profitable trade. In reality, a rapid price spike would have triggered the stop-loss order instantly. Testing on high-fidelity data eliminates this false confidence and ensures the simulated performance reflects real-world market turbulence.
Bid-Ask Spread Realities
Theoretical options prices differ from the actual executable prices available in the market. The difference between the highest price a buyer pays and the lowest price a seller accepts represents the bid-ask spread. Testing models that assume execution at the exact midpoint of this spread generate artificially inflated returns. Realistic simulation requires factoring in slippage and acknowledging that actual entries and exits occur at less favourable prices. Professional testing environments account for this liquidity friction automatically.
Options Chain Completeness
Unlike equity shares, options contracts expire weekly or monthly. A complete historical options chain must include every strike price available during that specific past trading session. If the data provider patches together incomplete chains, the testing software cannot accurately simulate dynamic strike selection. The software attempts to find the required Out-Of-The-Money strike, fails to locate the data, and either skips the trade or executes at an incorrect price. Comprehensive data archives guarantee the software executes the logic precisely as intended across all historical market conditions.
How can a beginner backtest Nifty strategy models without coding?
Beginners can backtest Nifty strategy models using visual strategy builders that require zero programming knowledge. Modern platforms provide simple drop-down interfaces where users select indicators, timeframes, and strike parameters. Algo Tradex Mind supports immediate access using just an email or mobile number, bypassing lengthy KYC procedures. Users construct conditions visually and run comprehensive tests instantly on secure cloud infrastructure.
Visual Builders vs Scripting Languages
In previous decades, testing required mastery of complex scripting languages like Python or C++. Traders spent months debugging code syntax instead of analysing market behaviour. Visual builders replace raw code with logical blocks. A user simply clicks to define 'If Nifty 50 closes above the 200-day moving average, buy ATM Call Option'. The platform translates these visual instructions into machine code backend, executing the test across years of data in seconds. This democratises quantitative analysis for retail participants.
Seamless Paper Trading Integration
Simulating historical performance represents only the first step. Moving directly from historical tests to live capital deployment carries unnecessary risk. Algo Tradex Mind provides 10 Lakhs in virtual capital for free paper trading. This allows beginners to deploy their visually constructed logic into live market data feeds without financial exposure. The system runs the automated rules in real-time, matching current price ticks and demonstrating exactly how the logic handles actual market volatility. Traders monitor the easy dashboard to verify execution accuracy.
The Value of Rapid Iteration
Market conditions evolve, requiring continuous strategy refinement. A non-coding environment enables rapid iteration. If a trader notices a Nifty trend-following model failing during sideways markets, they can simply open the visual builder, add a volatility filter like the Average True Range, and re-run the test immediately. This rapid feedback loop accelerates the learning process. The trader identifies what works, discards failing concepts, and optimises performance metrics without waiting for a developer to rewrite the underlying code architecture.
What are the best ways to backtest straddle/strangle setups in Indian markets?
To backtest straddle/strangle setups effectively, traders focus on time-based entry rules and strict premium decay targets. Selling ATM or OTM options requires systems to monitor the combined premium continuously. The software triggers exit orders when the overall position reaches a specific profit percentage or hits a defined combined loss limit, capturing theta decay while safely managing sudden directional index spikes.
The Mechanics of Short Straddles
A short straddle involves selling both a call and a put option at the exact same strike price. Traders deploy this logic to profit from time decay when they expect the underlying index to remain relatively stable. Testing this approach requires precise time execution. The Indian market frequently experiences heightened volatility during the first hour of trading. Testing a 09:15 AM entry against a 10:30 AM entry often yields drastically different risk profiles. The software executes these simulated entries across hundreds of trading sessions to identify the most statistically profitable time block.
Managing Strangle Delta Exposure
A short strangle involves selling out-of-the-money calls and puts, creating a wider breakeven zone. While this provides a higher margin of safety regarding index movement, it introduces delta exposure risks if the market trends aggressively in one direction. Effective testing requires implementing individual leg stop-losses. If the index surges upward, the call option loses value rapidly. The software must simulate closing the losing call leg at a predetermined loss limit while allowing the put leg to expire worthless, retaining that portion of the collected premium.
Handling Sudden Volatility Expansion
Option premiums inflate rapidly during extreme market events or unexpected news announcements. This volatility expansion destroys unprotected short option positions. Robust testing evaluates how the straddle or strangle logic performed during known historical crash events. Traders observe the maximum drawdown incurred during these specific days. If the system survives these extreme volatility spikes without decimating the account equity, the underlying logic possesses structural integrity. Proper position sizing and defined risk parameters separate professional automation from reckless gambling.
How does the win rate compare to max drawdown when evaluating a trading system?
A high win rate indicates the percentage of profitable trades, but max drawdown reveals the largest historical drop in account equity from its peak. Professional traders prioritise low drawdowns over exceptionally high win percentages. A system that wins frequently but suffers massive periodic losses destroys capital rapidly. Evaluating both metrics together provides a realistic picture of capital preservation during unfavourable market conditions.
Defining Capital Preservation Limits
Capital acts as the inventory for any trading operation. A system boasting a 90 percent win rate appears attractive initially. However, if the losing 10 percent of trades wipe out half the account balance, the system remains mathematically flawed. Max drawdown measures this exact vulnerability. It calculates the percentage drop from the highest account balance to the lowest subsequent trough before a new high is achieved. Traders use this metric to determine the psychological and financial viability of the underlying logic.
The Mathematical Reality of Recovery
Recovering from significant drawdowns requires exponential returns. A 10 percent drawdown requires an 11 percent return to break even. A 50 percent drawdown requires a 100 percent return just to restore the initial capital. Testing software calculates these metrics to highlight structural risks. If a simulated options selling approach shows a historical max drawdown of 40 percent, most traders will discard or modify the logic. Surviving such a drop in real-time requires immense psychological fortitude, which automated systems aim to bypass.
Balancing Reward Ratios
Traders achieve optimal performance by balancing the win percentage against the average risk-reward ratio. A trend-following options buying setup might only win 35 percent of the time. However, if the winning trades generate three times the return of the losing trades, the system remains highly profitable overall with a strictly controlled drawdown. The testing platform compiles these statistics into detailed performance reports, allowing users to assess the mathematical edge objectively rather than relying on intuition or emotional assumptions.
What is curve fitting and how can traders avoid overfitting during tests?
Curve fitting occurs when a trader adjusts strategy parameters excessively to produce perfect historical results. To avoid overfitting, traders must define simple, logical rules rather than hyper-optimising indicators for specific past events. A robust strategy performs consistently across different market cycles. Testing the logic on a completely separate out-of-sample dataset ensures the system possesses genuine predictive edge rather than historical coincidence.
Understanding Parameter Tweaking Dangers
Testing platforms allow users to modify moving average lengths, RSI thresholds, and stop-loss percentages instantly. A dangerous trap emerges when a trader runs hundreds of variations to find the absolute highest historical return. They might discover that an RSI setting of 63 coupled with a 14-minute timeframe generated massive profits in 2023. This represents classic curve fitting. The trader tailored the rules to perfectly match the random noise of that specific year. When deployed in live markets, these hyper-optimised systems inevitably fail because future market noise rarely replicates the past perfectly.
In-Sample vs Out-of-Sample Testing
Professional quantitative analysis divides available historical records into distinct segments. The trader builds and optimises the logic on the first segment, known as the in-sample data. Once the rules are finalised, the trader runs the system against the second segment, the out-of-sample data. The out-of-sample data acts as a proxy for live market conditions because the rules were never adjusted to fit it. If the performance metrics collapse during the out-of-sample test, the trader recognises the system is overfitted and discards the logic entirely.
Walk-Forward Optimisation Techniques
Walk-forward optimisation provides an advanced method for validating strategy robustness. The software tests the logic on a short block of data, optimises the parameters slightly, and tests it on the immediate next block. This process rolls forward sequentially through the entire historical dataset. It mimics the real-world process of periodically adjusting strategies as market regimes shift. Systems that survive walk-forward analysis demonstrate adaptability and fundamental structural logic, giving traders higher confidence before initiating fast order execution in live environments.
What subscription plans offer the best value for automated options testing?
Choosing the right subscription package depends on the required testing volume and broker connectivity. Algo Tradex Mind offers an inaugural 50% discount across all tiers. The plans provide distinct limits on saved strategies, total backtests, live deployments, and connected brokers. Each tier includes comprehensive index options trading support and substantial paper trading limits to refine models before risking live capital.
Platform Packages and Features
Algo Tradex Mind categorises subscriptions to match trader progression. The Basic Plan serves users ready to scale from manual to automated execution. The Limited Plan caters to premium members requiring portfolio testing and multiple broker connections. The Unlimited Plan delivers smart automation for rising traders managing complex, high-volume models across multiple accounts. All tiers include essential features like fast order execution, index options compatibility, and dedicated support channels.
| Feature | Basic Plan (1,299) | Limited Plan (1,999) | Unlimited Plan (2.999) |
|---|---|---|---|
| Target Audience | For traders ready to scale | For premium members | Smart automation for rising traders |
| Strategies | 30 strategies | 60 strategies | 150 strategies |
| Total Backtests | 60 backtests | 100 backtests | 250 backtests |
| Live Deployments | 3 live deployments | 5 live deployments | 12 live deployments |
| Broker Connections | Connect 1 broker | Connect up to 3 brokers | Connect up to 5 brokers |
| Paper Trading | 10 Lakhs worth included | 10 Lakhs worth included | 10 Lakhs worth included |
| Portfolio Testing | Single strategy execution | Test 3 strategies together | Test 10 strategies together |
| Reporting | Easy dashboard | Simple performance reports | Detailed performance reports |
| Risk Management | Standard execution | Fast order execution | Daily loss limit with one-tap stop |
| Support Level | Email support | Chat support | Priority support & setup call |
The Unlimited tier exclusively features a trade journal and newsletter access, alongside early access to new platform features. Traders migrating from complex coding environments will find the strategy building templates intuitive across all package levels.
How does option Greek analysis improve systematic testing results?
Systematic testing relies heavily on understanding how options Greeks influence contract pricing. Delta measures the directional risk, indicating how much the option price moves for every one-point move in the underlying index. Automated software tracks delta constantly to determine if a position remains within acceptable risk limits. Gamma measures the rate of change in delta, accelerating as contracts approach expiration. High gamma exposure causes violent price swings in the final days of a contract, frequently triggering stop-losses unexpectedly. Proper testing models incorporate gamma filters to close positions before expiration day volatility destroys the accumulated premium.
Theta represents the daily decay of the option premium. Traders selling strangles depend entirely on theta to generate profits. The testing software calculates exact theta decay curves, demonstrating how weekends and market holidays impact profitability. Vega measures sensitivity to implied volatility. When market panic sets in, vega expands, inflating option prices rapidly even if the underlying index remains stagnant. Thorough simulation tracks vega spikes during past market crashes, ensuring the automated rules survive sudden volatility shifts without triggering catastrophic margin calls.
What role does slippage play in realistic execution models?
Slippage represents the hidden cost of trading. It occurs when a market order executes at a different price than intended due to rapid price movement or low liquidity. If a testing platform ignores slippage, the theoretical returns look magnificent. However, reality hits hard when live orders fill five points worse than expected. Executing 100 trades a month with a five-point slippage destroys 500 points of profit systematically. High-quality platforms apply realistic slippage models to historical tests, deducting standard friction costs from the gross profit to present an accurate net return.
Brokerage fees and transaction taxes further erode gross returns. Indian markets impose Securities Transaction Tax (STT), stamp duty, exchange transaction charges, and GST on every trade. A strategy executing 20 trades daily might generate gross profits, but the accumulated taxes render it net negative. Accurate simulation software deducts these precise statutory charges from the backtested results. Traders must evaluate the net profit curve rather than the gross curve to confirm genuine financial viability.
Why is API latency critical for automated options execution?
Latency measures the delay between the software generating a trade signal and the broker executing the actual order at the exchange. High latency ruins time-sensitive setups. If a system identifies a breakout and sends a buy order, a two-second delay allows the index to surge past the optimal entry point. The trader suffers immediate slippage. Algo Tradex Mind connects directly to broker APIs using streamlined data routing protocols. This minimises transit time, ensuring the simulated entry prices closely match live execution realities.
Cloud server architecture dictates this speed. Running automated rules on a personal computer introduces massive latency risks. Local internet drops, power failures, or operating system updates interrupt the connection, leaving open positions completely unmanaged. Hosting the logic on dedicated cloud servers ensures uninterrupted uptime. The cloud infrastructure communicates with broker APIs continuously, managing trailing stop-losses and profit targets with millisecond precision regardless of the trader's local hardware status.
Frequently asked questions
How much capital is required to start automated trading?
Capital requirements depend on your broker and chosen positions. Selling options requires standard margin limits mandated by exchanges. The software simply automates execution. Beginners should utilise free paper trading to test strategies thoroughly before allocating any actual funds.
Does the platform provide pre-built trading setups?
We operate strictly as a SaaS software provider and do not offer pre-built strategies, advisory services, or financial recommendations. Users must design, configure, and manage their own logical conditions based on personal market analysis and individual risk tolerance.
How quickly does the system execute live market orders?
Execution speed relies heavily on the broker API response time and current market liquidity. Our platform connects directly to broker APIs to minimise latency. Fast order execution reduces slippage, ensuring your entry and exit prices match your system logic.
Can I test multiple strategies simultaneously?
Yes, higher tier subscriptions allow portfolio testing. The Limited Plan supports testing three strategies together, while the Unlimited Plan accommodates ten. This feature helps traders understand how different logical models interact and affect overall account equity simultaneously.
Is coding experience necessary to build conditions?
No coding experience is required. The platform features intuitive strategy building templates and an easy dashboard. Traders select their parameters from drop-down menus to construct logic, making advanced automation accessible to individuals without computer science backgrounds.
Disclaimer: Algo Tradex Mind provides SaaS software for trade automation and testing. We do not offer financial advice, stock recommendations, or pre-built strategies. Trading involves risk, including the potential loss of capital. Historical performance does not guarantee future results. Users hold full responsibility for their strategy design and live execution outcomes.